38 men and 25 women
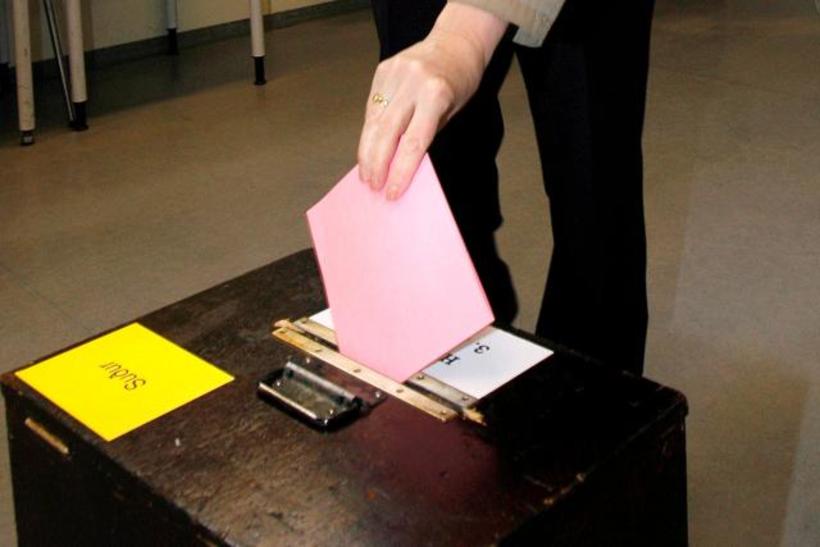
Iceland's most recent general elections took place on 27 April 2013. mbl.is/Brynjar Gauti
Fifteen political parties contested the 2013 general elections in Iceland, eleven of them fielding candidates in all constituencies. 58.1% of the 1,512 candidates were men and 41.9% women. The proportion of women among the top three candidates across the parties was 41.2%. Of the 63 MPs elected to the Icelandic Parliament (known as ‘Alþingi’ in Icelandic), 38 (60.3%) were men and 25 (39.7%) were women, two fewer than in the 2009 general elections.
Statistics Iceland, Iceland’s main official national statistics body, has recently published statistics on the results of the general elections which took place on 27 April 2013. A total of 237,807 voters, 73.6% of the Icelandic population, were registered to vote. Turnout was 81.5%, the lowest turnout for general elections since 1942. Turnout was 81.9% for women and 81.1% for men. 16.6% voted by post, as compared to 12.5% in the 2009 elections.
97.5% of the votes cast in the 2013 general elections were valid. Six parties gained over 5% of the vote and had MPs elected to Alþingi. These parties performed as follows: Bright Future (‘Björt framtíð’) – 8.2% (six MPs); the Progressive Party (‘Framsóknarflokkurinn’) – 24.4% (nineteen MPs); the Independence Party (‘Sjálfstæðisflokkurinn’) – 26.7% (nineteen MPs); the Social Democratic Alliance (‘Samfylkingin’) – 12.9% (nine MPs), the Left-Green Movement (‘Vinstrihreyfingin - grænt framboð’) – 10.9% (seven MPs); the Pirate Party (‘Píratar’) – 5.1% (three MPs). Other parties received a total of 22,300 votes, i.e. 11.8% of valid votes.